




Briefing
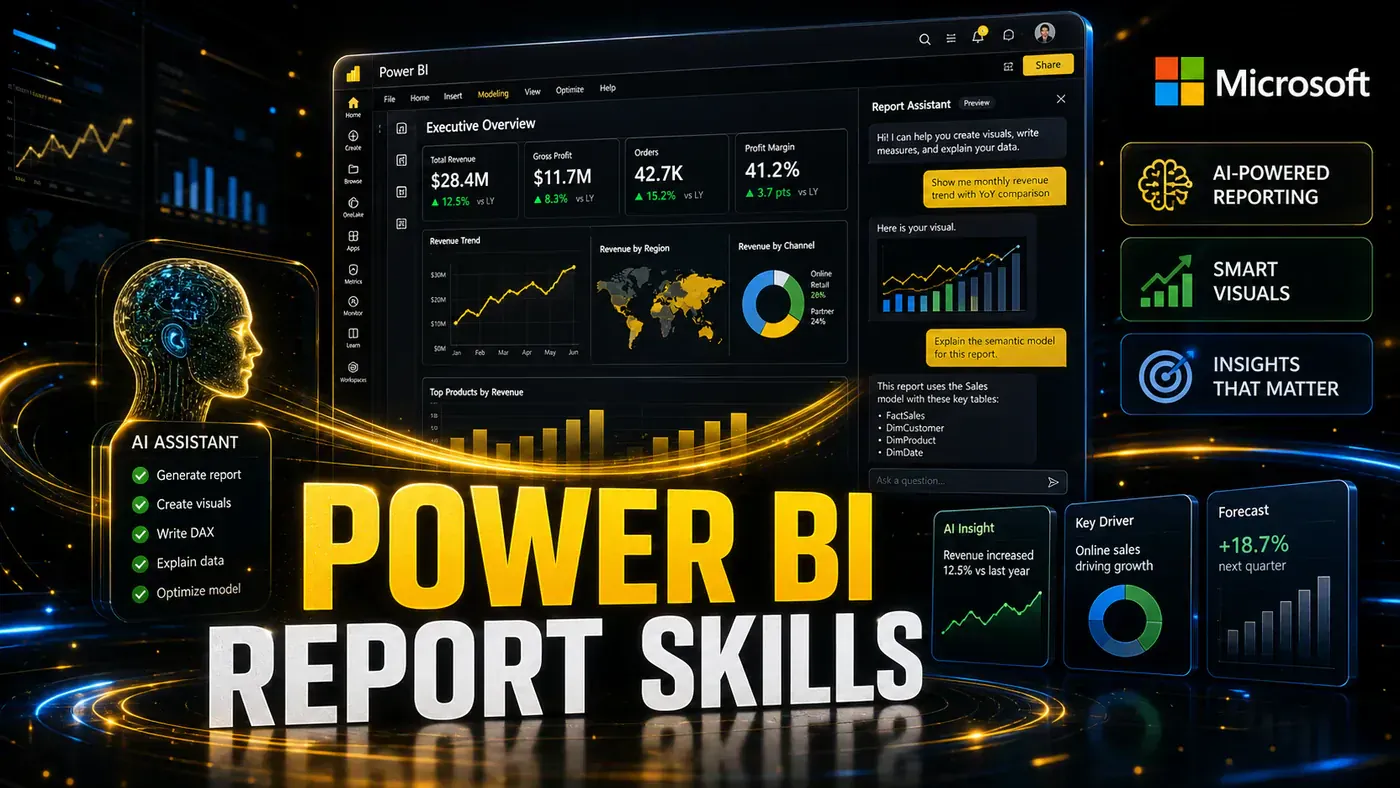
Banner Image Prompt: A futuristic holographic data dashboard floating in a dark blue environment, showing AI-generated Power BI charts and visualisations with glowing neon accents, a developer silhouette working in the foreground with a terminal and code editor, Microsoft Fabric and Power BI logos subtly integrated, cinematic lighting with teal and purple colour palette, ultra-modern tech aesthetic.
The Future of Reporting Just Landed
For years, building a polished Power BI report followed a familiar - if laborious - pattern. Hours spent dragging visuals onto canvases, tweaking DAX measures, adjusting colour schemes, aligning slicers, and iterating with stakeholders. It was work that demanded both technical skill and design sensibility, and it consumed a significant chunk of any BI developer's week.
That workflow is being fundamentally reimagined.
At Microsoft Build 2026, the company unveiled Agent Skills for Power BI - AI-powered capabilities that enable agents to handle the full analytics development cycle, from raw data to semantic model to published report, based on nothing more than a plain-language description or even a screenshot. Among these, the Power BI Report Authoring skill stands out as the most immediately transformative for working BI professionals.
In a recent video from the Guy in a Cube YouTube channel, Marthe ("Gal in a Cube") put these capabilities through their paces. With nearly 29,000 views in a single day, the video demonstrates step-by-step how analysts can now go from a text prompt to a functional report in minutes rather than hours.
As one commenter aptly put it: *"I'm both excited and terrified at the same time."*
So what exactly are Power BI Report Skills? How do they work? And what do they mean for BI developers? Let us dive in.
What Are Power BI Report Skills?
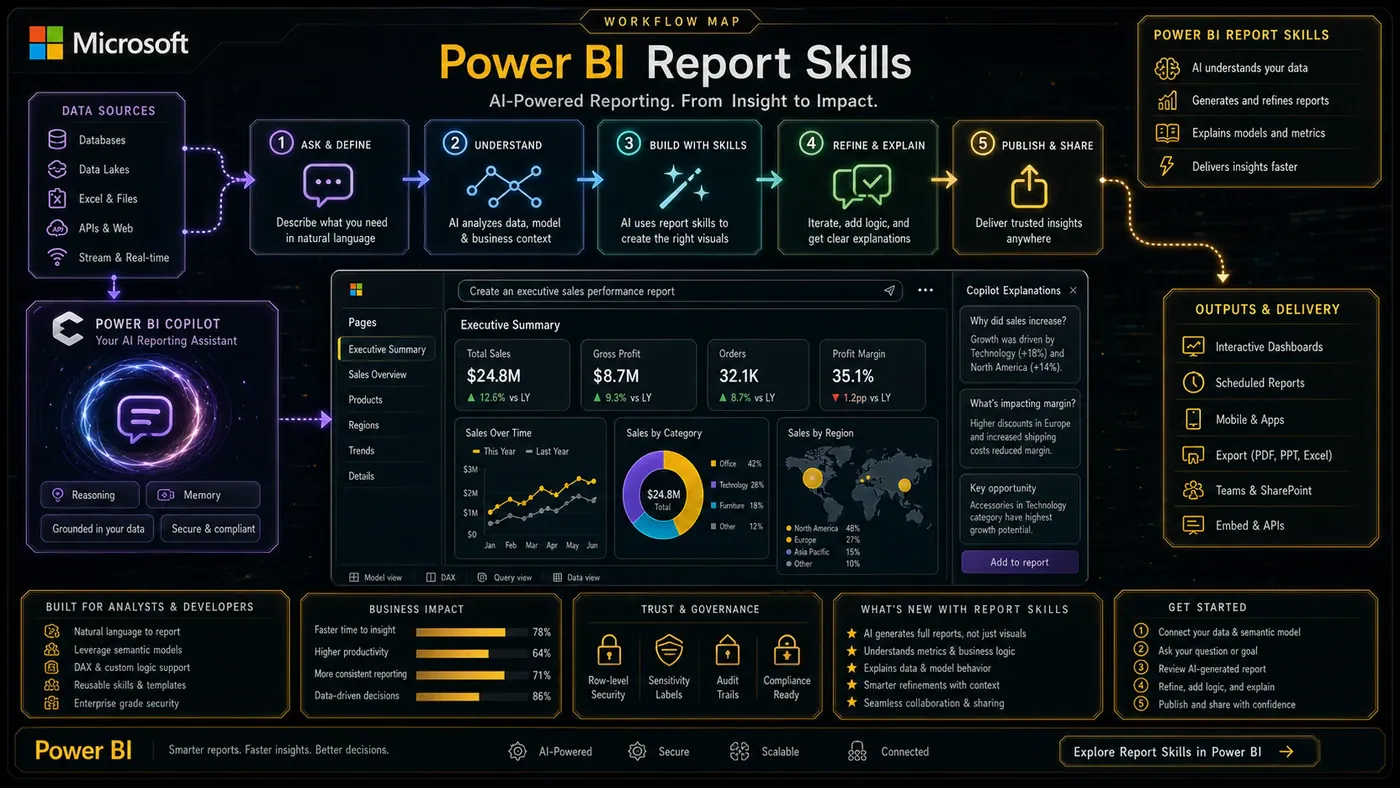
Power BI Report Skills are part of Microsoft's broader Skills for Fabric initiative - an open-source collection of AI-agent instructions that allow tools like GitHub Copilot CLI, Claude, Cursor, and VS Code Copilot to interact directly with Microsoft Fabric workloads, including Power BI reports and semantic models.
According to Microsoft, the Power BI Report Authoring skill (powerbi-report-authoring) enables "natural-language authoring, modification, and validation of Power BI report definitions in the PBIR (Power BI Report) format used by PBIP (Power BI Project) files." You describe what you want in plain English; the AI agent writes the report code.
This is fundamentally different from Copilot's existing in-app assistance, which helps a human doing the work. Report Skills are designed to *complete* the work autonomously - generating pages, adding visuals, formatting layouts, and validating renders.
The Power BI Authoring plugin bundles several related skills:
| Skill | Purpose |
|---|---|
powerbi-report-authoring | Creates and modifies report pages, visuals, filters, themes, and formatting |
powerbi-report-design | Produces structured design briefs for visual guidance before code is written |
powerbi-report-planning | Guides requirements-to-implementation workflow with approval gates |
powerbi-report-management | Manages workspace items via Fabric REST API |
semantic-model-authoring | Handles tables, columns, DAX measures, and model relationships |
These skills work with the Power BI Modeling MCP server and Power BI Desktop CLI bridge, creating an end-to-end loop: plan → design → author → validate → verify → publish.
Getting Started: Installation and Setup
Marthe's walkthrough begins with installation. The process is straightforward but requires a few prerequisites.
Prerequisites
- GitHub Copilot CLI - Command-line interface for GitHub's AI assistant
- Node.js 18 or later - Required for the Power BI Modeling MCP server
- Power BI Desktop - For live verification and screenshot review
- A PBIP (Power BI Project) file - The source-control-friendly format the agent edits
Step 1: Register the Skills Marketplace
$ /plugin marketplace add microsoft/skills-for-fabricStep 2: Install the Power BI Authoring Plugin
$ /plugin install powerbi-authoring@fabric-collectionThis single command installs the report authoring, design, and planning skills, plus the semantic model authoring capability and Power BI Modeling MCP server - pre-configured and ready to use.
Step 3: Verify the Installation
Run the /skills command and confirm that semantic-model-authoring and powerbi-report-authoring appear in the list. Once they do, you are ready to start prompting.
Test One: Creating a Report from a Single Prompt
With the setup complete, Marthe moves to the first real test: can a single natural-language prompt produce a working Power BI report?
The answer, demonstrated clearly in the video, is yes - with some important caveats.
The Power BI Report Authoring skill works directly with the PBIR files on disk. When you issue a prompt like "Create a report with a page called Opportunities that has four KPI cards for Revenue Won, Revenue in Pipeline, Revenue Lost and Opportunities," the agent:
- Inspects the semantic model to understand available tables, columns, and measures
- Writes the PBIR JSON definitions for the requested pages and visuals
- Binds each visual to the correct data fields
- Applies sensible default formatting and layout
- Validates the resulting PBIR structure
- Reloads Power BI Desktop and captures a screenshot for visual verification
The skill supports an impressive range of visual types - KPI cards, bar charts, tables, slicers, clustered column charts, line charts, matrices (now called pivot tables), and more. It handles formatting including themes, colour schemes, conditional formatting, and visual alignment.
What makes this more than a simple template generator is the agent's ability to *iterate*. If the first screenshot reveals a problem - a visual rendering as an error icon, a layout issue, or a missing filter - the agent can diagnose the underlying cause (often a queryState or role binding issue in the PBIR JSON) and fix it in the next pass.
Test Two: Using an Inspiration Report
The second demonstration takes the concept further. Rather than describing what you want in words, you can provide the agent with an existing report - an "inspiration report" or "inspo report" - and ask it to create something similar.
This is where the capabilities become genuinely powerful for real-world BI development. Most organisations have reports that stakeholders love, with specific layouts, branding, and interaction patterns they want replicated across new datasets. Traditionally, this meant manually recreating every visual, formatting setting, and interaction from scratch.
With the Report Authoring skill, the agent can:
- Analyse the structure and design of the inspiration report
- Extract the page layout patterns, visual types, and formatting choices
- Apply that same design language to a new semantic model
- Produce a report that matches the organisational style guide without manual rework
This "modernisation" workflow also works in reverse: you can point the agent at an outdated report and ask it to upgrade legacy visuals (converting old card visuals to modern cardVisual, or matrices to pivotTable) while reapplying the correct formatting.
The End-to-End Agentic Workflow
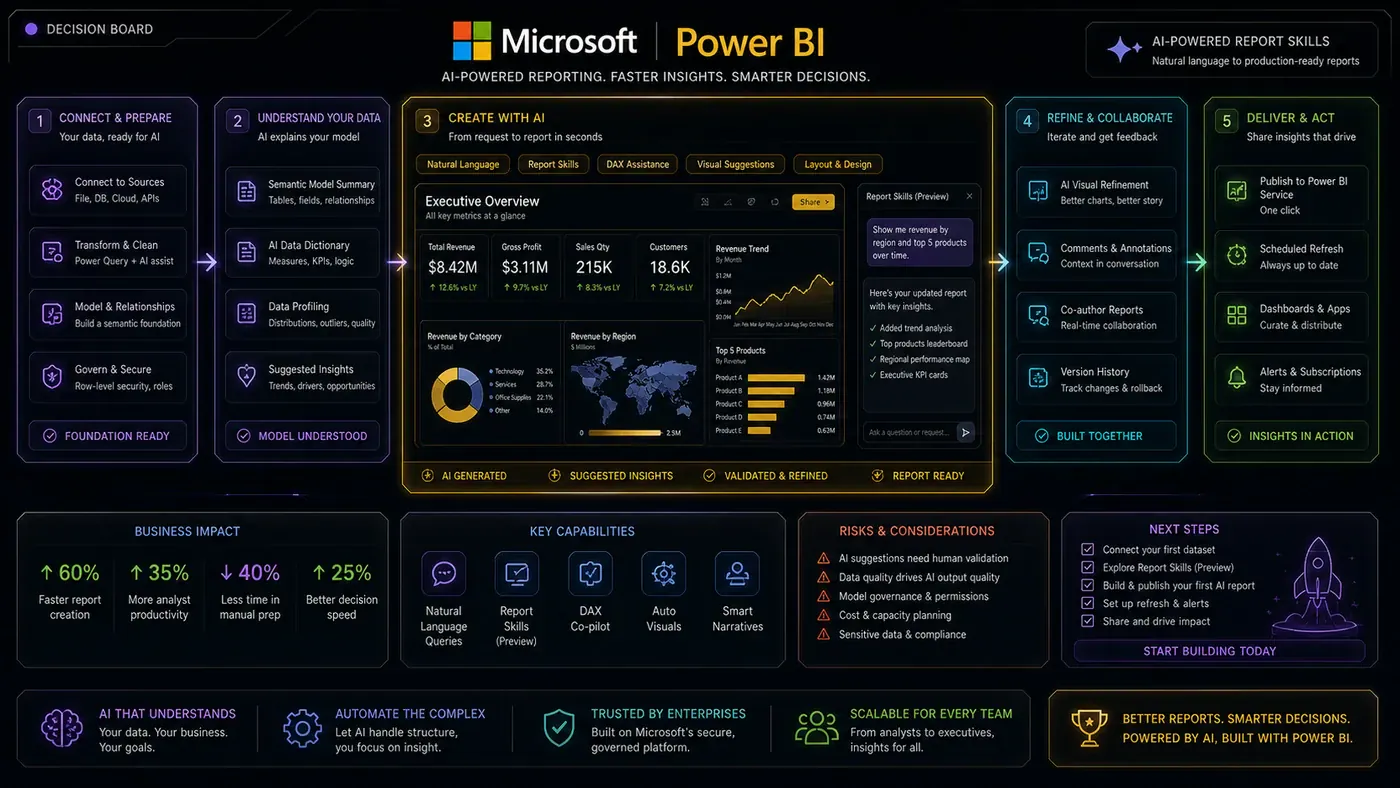
What Microsoft has built is not a single feature but a *system* - a complete agentic workflow spanning the entire reporting lifecycle:
1. Plan - The powerbi-report-planning skill guides requirements gathering: audience, scope, page plan, and dependencies. It produces a locked report specification requiring explicit approval.
2. Design - The powerbi-report-design skill produces a structured design brief covering page archetypes (executive summary, operational monitor, analytical canvas), chart selection, layout, colour, and typography.
3. Author - The powerbi-report-authoring skill implements the design brief, editing PBIR files to create pages, visuals, filters, slicers, bookmarks, and themes.
4. Validate - The validate-report command catches structural problems - incorrect JSON schema, invalid properties, missing references, and layout issues.
5. Verify - The Power BI Desktop bridge reloads the report and captures screenshots for visual review.
6. Publish - The powerbi-report-management skill deploys the finished report to a Fabric workspace via REST API.
This workflow can operate autonomously for well-defined tasks, or in assisted mode where the analyst approves each step.
What This Means for Analysts and BI Developers
The arrival of AI-powered report authoring raises important questions for working BI professionals. Is this the beginning of the end for Power BI developers? Should analysts be worried?
The honest answer is: not yet - but the nature of the work is undeniably shifting.
The Semantic Model Becomes the Critical Foundation
Microsoft has been explicit about what makes agentic analytics work: the semantic model. A well-curated semantic model - with clean measures, defined relationships, proper hierarchies, and business terminology attached to the correct columns - is now the layer that allows AI agents to reason correctly over your data.
An agent building on top of a poorly structured model produces unreliable output. An agent working from a properly governed model can produce trustworthy analytics because it inherits the business logic that data professionals have already encoded.
This actually *increases* the importance of skilled data modelling. The better the model, the more the agent can do with it. The agents handle the repetitive visual work, but the semantic layer remains a human responsibility - at least for now.
New Skills Become Valuable
For BI professionals, the skill set is evolving. Deep DAX knowledge and visual design expertise remain valuable, but understanding how to build semantic models that AI agents can work with reliably - clean relationships, well-named measures, governed data assets - is becoming the skill that determines whether your AI investment actually delivers.
Similarly, familiarity with developer tooling (Git, CLI workflows, PBIP projects, CI/CD pipelines) is transitioning from "nice to have" to "essential" as Power BI becomes increasingly code-first.
Practical Value Today
As Marthe notes in the video, the immediate practical value is speed. Tasks that previously consumed hours - creating initial report drafts, applying consistent formatting, modernising legacy visuals, replicating design patterns across reports - can now be accomplished in minutes with a well-crafted prompt.
The technology is in preview, and the usual caveats apply: validation is essential, human oversight remains critical, and complex business logic still requires a human analyst's judgement. But the direction of travel is clear. As one YouTube commenter observed, even sceptical users can see immediate value for specific tasks like getting "best fit" alignment and exact spacing between visuals - something that can be quickly quality-assured and corrected.
Limitations and Considerations
The preview status of Power BI Report Skills means there are important limitations to keep in mind.
PBIP-only format. The Report Authoring skill works only with PBIP (Power BI Project) files, not traditional PBIX files. If your organisation has not yet adopted PBIP projects, you will need to convert your reports first.
Source control discipline matters. Because the agent edits files directly on disk, Microsoft strongly recommends committing a baseline to Git before allowing the agent to make changes. The PBIR file is the source of truth - any unsaved changes in Power BI Desktop will be overwritten when the agent iterates.
Legacy visual deprecation. Some older visual types - including Q&A, Bing maps, and filled maps - will be deprecated soon. The agent will not create reliable reports using these visuals, and migrations to modern equivalents may be needed.
Cross-tool compatibility. While optimised for GitHub Copilot CLI, the skills provide cross-tool compatibility for VS Code Copilot, Claude Code, Cursor, Codex/Jules, and Windsurf. However, your experience may vary depending on which tool you use.
Human review remains essential. The agent can produce structurally correct reports, but business context, data quality validation, and stakeholder alignment still require human judgement.
Conclusion: The Agentic Era of Analytics
Microsoft's push into agentic analytics, demonstrated by the Guy in a Cube team, represents a genuine inflection point for the BI industry. The Power BI Report Authoring skill is not a minor productivity enhancement - it is a foundational shift from manual construction to conversational specification.
For organisations invested in Microsoft Fabric and Power BI, the implications are immediate. Describing a report in natural language and having an AI agent produce a working PBIP project in minutes collapses development timelines dramatically. For BI teams drowning in report requests, this is potentially transformative.
Yet the technology reinforces a truth practitioners have long understood: the quality of your analytics is determined by the quality of your data model. The semantic model was always important. In the agentic era, it is everything. Organisations with clean, well-governed semantic models will find AI agents amplifying their work exponentially. Those without will discover that AI simply automates bad outputs faster.
The future of Power BI reporting is not human versus machine - it is human *with* machine. Analysts who embrace these tools, who learn to work alongside AI agents, and who double down on the data modelling foundations that make agentic analytics possible, will operate at a level of productivity that seemed impossible months ago.
As Marthe's walkthrough makes clear: what used to take hours can now start with a simple prompt. The future of AI-powered reporting is here.
Helpful Resources
Official Microsoft Documentation
- Power BI Report Authoring Skill Overview (opens in a new tab) - Microsoft's official documentation for the report authoring skill, including use cases, workflow details, and anti-patterns to avoid.
- Power BI Agentic Overview (opens in a new tab) - High-level guide to Power BI's agentic capabilities, including installation instructions and skill descriptions.
- Power BI Desktop Projects (PBIP) (opens in a new tab) - Documentation for the Power BI Project format, enabling source control and code editor support.
- What's New in Power BI (June 2026) (opens in a new tab) - Latest feature summary including Fabric Apps, Copilot in web modeling, and AI-powered report authoring.
- AI-Powered Power BI Reporting from Design to Deployment (opens in a new tab) - Official Microsoft blog post demonstrating the report authoring capabilities.
- Building in the Agentic Era with Power BI and Fabric (opens in a new tab) - Microsoft's Build 2026 announcement blog.
GitHub Repositories
- microsoft/skills-for-fabric (opens in a new tab) - The official open-source repository for Fabric Skills, including installation instructions and the full changelog.
- Power BI Report Authoring Skill (SKILL.md) (opens in a new tab) - Detailed skill definition and authoring guide.
- Skills for Fabric Changelog (opens in a new tab) - Release notes tracking new skills and capabilities.
- JSON Schemas for Power BI Projects (opens in a new tab) - Public JSON schemas for PBIP file validation and IntelliSense.
Video and Community Content
- Guy in a Cube YouTube Channel (opens in a new tab) - The original source video and extensive Power BI/Fabric content library.
- Guy in a Cube Membership (opens in a new tab) - Community membership for extended content.
- Guy in a Cube on LinkedIn (opens in a new tab)
- Guy in a Cube on Bluesky (opens in a new tab)
- Guy in a Cube on Twitter/X (opens in a new tab)
Related Tools and Frameworks
- GitHub Copilot CLI - Required for the primary installation path; command-line AI assistant.
- Power BI Modeling MCP Server - Enables AI agents to connect to Power BI Desktop and Fabric workspaces.
- Power BI Desktop Bridge CLI - Allows agents to reload Desktop, capture screenshots, and verify rendering.
- Claude Code / Cursor / Windsurf / Codex - Alternative AI coding tools with cross-compatibility for Fabric Skills.
Learning and Training
- Enterprise DNA: Power BI Agent Skills at Build 2026 (opens in a new tab) - Detailed analysis of the Build 2026 announcements.
- Microsoft Fabric Community Blog (opens in a new tab) - Official updates and feature announcements.
- FabCon Europe 2026 (opens in a new tab) - European Fabric community conference (Barcelona, 28 September – 1 October 2026).